

The brief
Argus is a product of the business group Marketing MIX belongs to, so this case describes our own work. Public funding data in Canada is open, but it is spread across separate datasets: federal contracts, federal grants and contributions, provincial contracts and grants, charity tax filings and the lobbying registry. Each one uses its own names and formats for the same organisations. An analyst who wants to see where one recipient appears in several streams, or where money moves in a circle, has to join those files by hand first.
The brief was a workspace that does the joining and the first pass of pattern checks, ranks what deserves a person's attention, and keeps every signal tied to the source records, with a clear warning that a signal is a reason to look and nothing more.
What we built
The method
Argus ingests contracts, grants, charity filings and lobbying records into PostgreSQL, matches records across the datasets and runs a set of checks. Each check is a section of the workspace:
- Concentration: departments where a single vendor takes a dominant share.
- Sole source: non-competitive awards and patterns of repeated amendments.
- Funding loops: circular flows between charities and other entities, found with graph analysis.
- Duplicative funding: entities that receive money from two or more programs, such as sole-source awards, provincial contracts and grants, and federal grants at once.
- Growth: year-over-year changes in funding by department, where a large jump or drop may point to a new program, emergency spending or a pattern worth review.
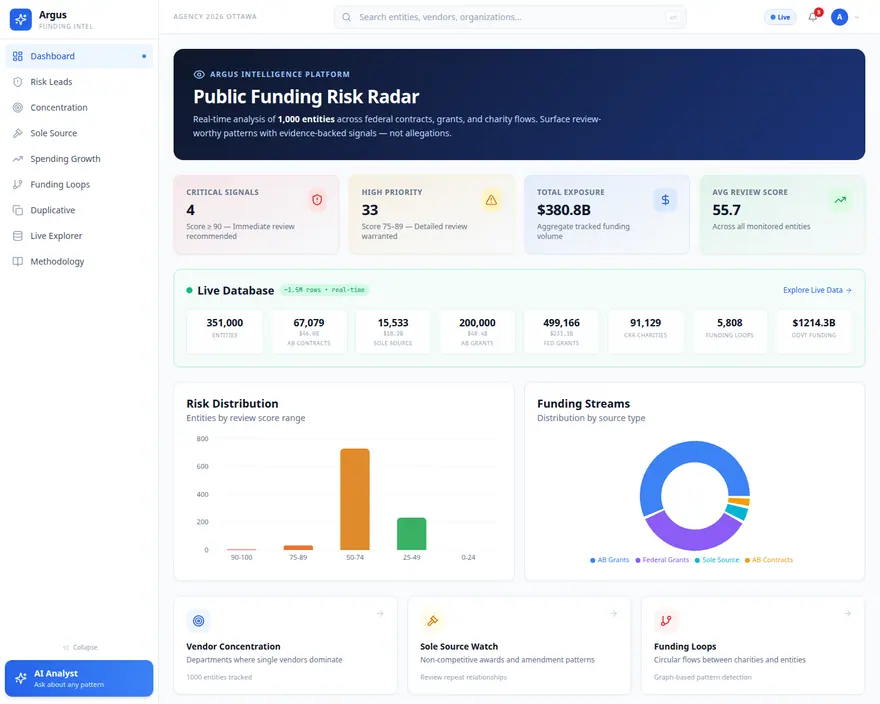
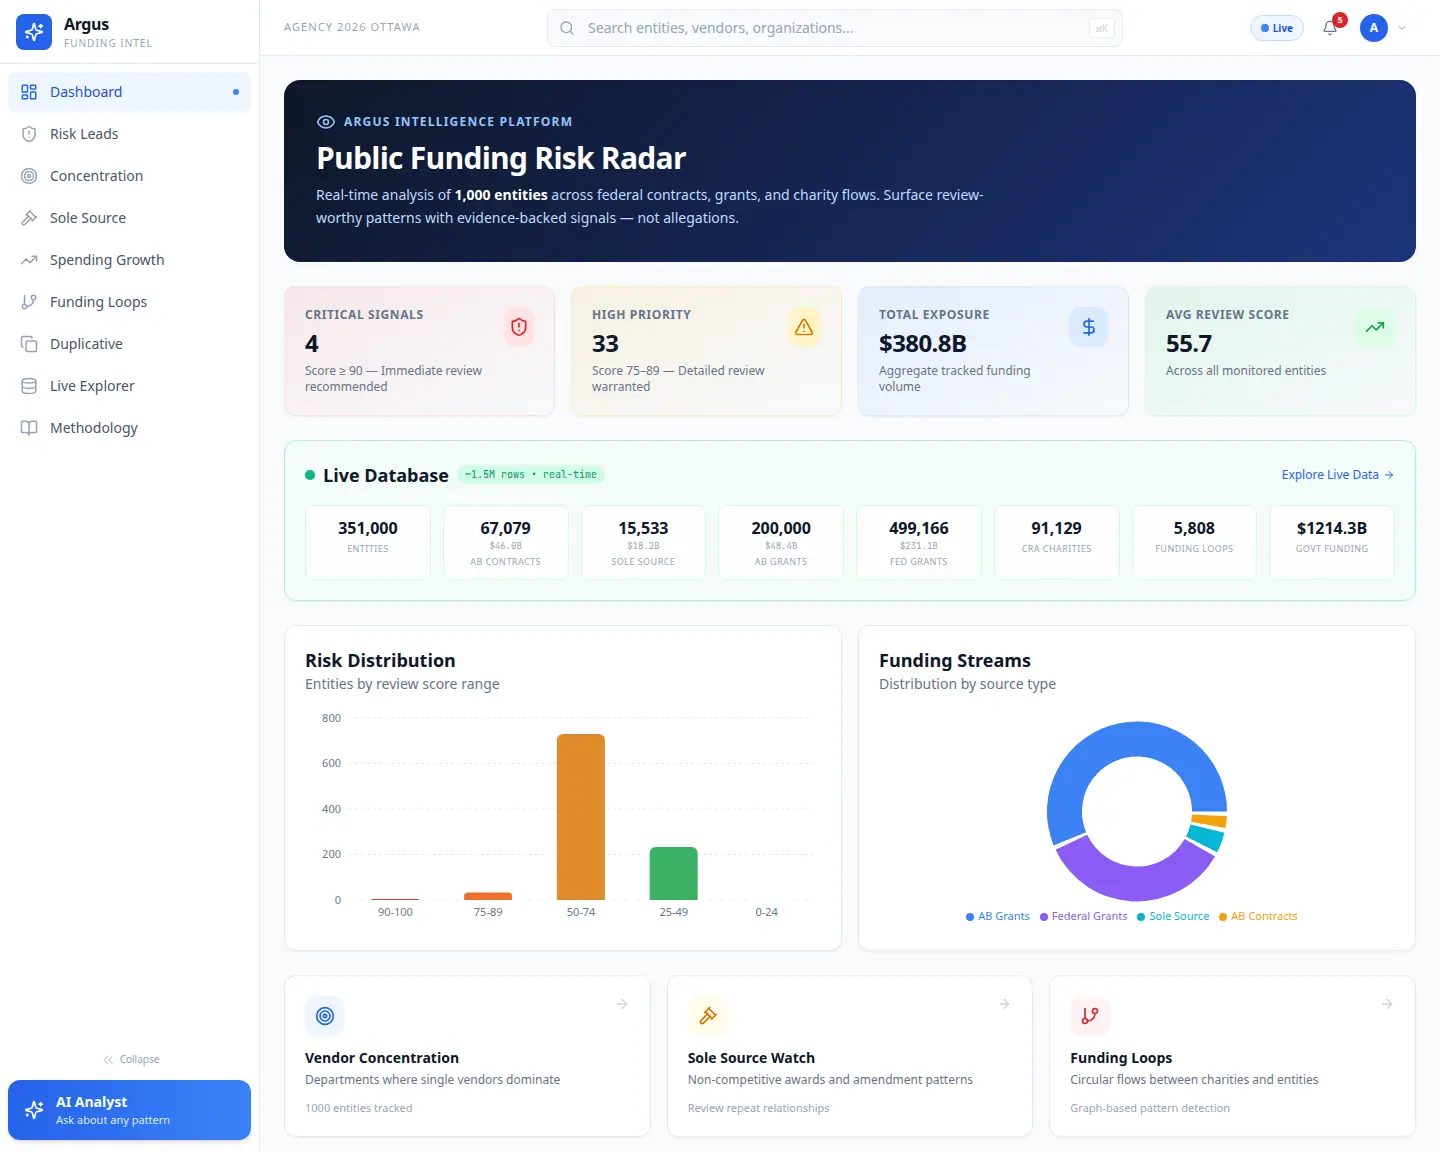
The results feed a review score for every entity. Scores of 90 and above are marked critical and scores from 75 to 89 high priority. Each lead in the list carries its key signal in plain words, for example the share of a department's spending or the number of funding streams the entity appears in, and opens into an entity page with the evidence.
The workspace
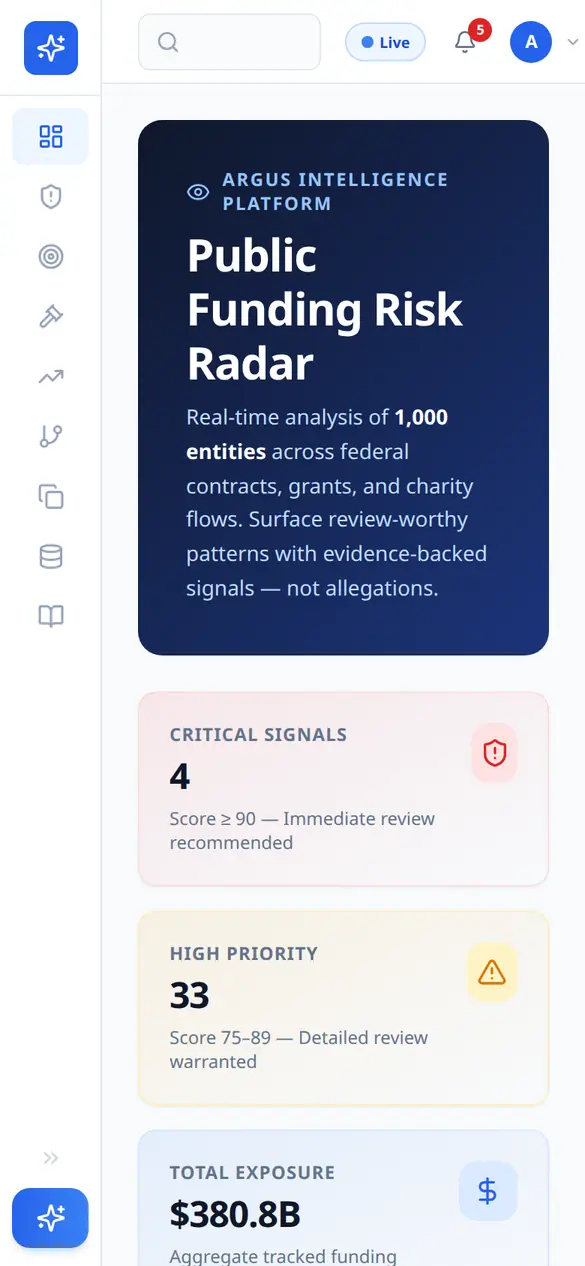
Argus is a Next.js 15 application in TypeScript with Tailwind, with API routes for the dashboard, leads, each type of check, search, exports and an assistant view. It reads a live database through materialised views and can fall back to a stored snapshot, so the interface still works when the database is unavailable. The dashboard shows the score distribution, the funding streams, vendor concentration, a sole-source watch, funding loops and the top leads. The data explorer runs live queries against about 1.5 million rows, search finds any entity, and exports take a selection out for further work.
The methodology page
A tool that ranks named recipients needs to say clearly what its scores mean. The methodology page describes the platform in three verbs (discover, analyse, review), lists the data sources and the pipeline, and states the rule that runs through the whole product: Argus produces ranked review leads, clear explanations and source-backed evidence trails, and it does not accuse anyone. The same note sits under the lead list on the dashboard.
Where it stands today
On 8 November 2026 the workspace answers at forensi.ca in English, with 10 addresses in its sitemap: the dashboard, methodology, explore, search, funding loops, sole source, concentration, growth, duplicative funding and leads. Work on the code ran from April to October 2026.
Related
Web applications for organisations: corporate websites. Public-sector work: government websites. Another product of our group: Huginai.
Project lead: Marketing MIX. Product: Argus, the public funding analytics workspace of our business group. Year: 2026.